


Chart of Accounts
Learn how a chart of accounts organises your bookkeeping, with account categories, numbering examples and a free sample chart of accounts to download.
Chart of Accounts Definition
A chart of accounts is a list of all the accounts used to record your business transactions. It organises your bookkeeping into categories such as income, expenses, assets and liabilities, allowing you to produce reports including the Profit and Loss Account and Balance Sheet.
Every business will have slightly different accounts. You can create your own or customise the standard chart of accounts included with most accounting software.
Below are some examples of accounts that your small business may use.
Disclosure: This content may contain affiliate links, which means if you click on them, I may get a commission (without any extra cost to you).

This guide explains how a chart of accounts works, the different account categories and how they help keep your bookkeeping organised.
Chart of Accounts at a Glance
- A chart of accounts is a list of all the accounts used in your bookkeeping.
- It groups transactions into assets, liabilities, income, expenses and equity.
- It helps produce accurate financial reports.
- Most accounting software includes a standard chart of accounts.
- You can customise it to suit your business.
Importance of the Chart of Accounts
The chart of accounts is the foundation of your bookkeeping system. Every financial transaction is recorded against one of its accounts, so a well-organised chart of accounts helps ensure your financial reports are accurate and meaningful.
Choosing the correct account for each transaction is important. If transactions are posted to the wrong account, your Profit and Loss Account and Balance Sheet may not reflect the true financial position of your business. As your business grows, you can add new accounts to record transactions in more detail. Most accounting software also includes some accounts you may not need straight away, but you can leave these in place or remove them if you prefer a simpler chart of accounts.
Even if you keep your books in an Excel spreadsheet rather than using accounting software, you’ll still need a chart of accounts. It may be smaller and less detailed, but you’ll still use it to categorise your income and expenses. For example, our free Excel Cash Book Template includes five income accounts and thirteen expense accounts, which you can rename to suit your business.
How the Chart of Accounts Works in Everyday Bookkeeping
The chart of accounts sits behind almost every transaction you record.
For example, imagine you send a customer an invoice for £500. The sale is recorded in your Sales account, while the amount the customer owes is recorded in your Trade Debtors account. When the customer pays the invoice, the money moves into your Bank account, and the Trade Debtors balance decreases.
Every transaction works similarly. The chart of accounts acts as the framework that keeps your bookkeeping organised and allows your bookkeeping software to produce reports such as the Profit and Loss Account and Balance Sheet.
How to Create a Chart of Accounts
Creating a chart of accounts begins with thinking about the type of information you want from your bookkeeping. Every business needs an accounts structure to record assets, liabilities, income and expenses, but the exact structure will depend on the size and nature of your business.
Many accounting software packages provide a standard chart of accounts, giving you a good starting point. You can then rename accounts, remove those you don’t need and add new ones as your business develops. Keeping the structure simple is usually the best approach. A small business rarely benefits from having hundreds of accounts, and a clear, organised chart is much easier to maintain.
Best Practices for a Chart of Accounts
A chart of accounts should make bookkeeping easier, not more complicated. One of the most common mistakes is creating far more accounts than necessary. Although it may seem helpful to have a separate account for every type of expense, this usually results in reports that are difficult to read and maintain.
In most cases, it’s better to keep your chart of accounts as simple as possible. Similar expenses can often be grouped, while clear account names make it much easier to understand your financial reports. As your business grows, you can always add new accounts if they’re genuinely needed.
It’s also worth reviewing your chart of accounts every year. Businesses change over time, and accounts that were useful when you first started may no longer be relevant. Rather than deleting old accounts, most software allows you to make them inactive, preserving your historical records while keeping your chart organised.
For many small businesses, a simple chart of around 40 to 80 accounts is more than enough.
Chart of Accounts Software
Although you can create a chart of accounts manually, most small businesses find it much easier to use accounting software. The software includes a standard chart of accounts, so you don’t have to build one from scratch. You can then add, remove or rename accounts to suit the way your business operates.
Many accounting packages also ask about your business during the setup process. For example, if you choose a retail, construction or service business, the software may create a chart of accounts that’s better suited to your industry. This gives you a good starting point, although you can customise it as your business grows.
If you’re looking for bookkeeping software, Xero is an excellent choice for businesses that want a modern, easy-to-use system with plenty of flexibility. Its chart of accounts is simple to customise, making it suitable for many sole traders and small businesses.

QuickBooks also includes a default chart of accounts and guides you through the setup process. It’s a good option if you’re new to bookkeeping and want software that helps you get started quickly.
Whichever software you choose, it’s worth taking a few minutes to review the default chart of accounts. Removing accounts you don’t need and adding any that are specific to your business will make your bookkeeping easier and your financial reports more meaningful.
Common Chart of Accounts Mistakes
A chart of accounts should make bookkeeping easier, not harder.
Some common mistakes include:
Creating too many accounts – It’s tempting to create a separate account for every expense, but this often makes reports difficult to read.
Using vague account names – Accounts such as “General Expenses” or “Miscellaneous” don’t provide much useful information.
Mixing personal and business spending – Business expenses should be recorded separately from personal purchases.
Ignoring the chart once it’s created – As your business changes, your chart of accounts should be reviewed to make sure it still reflects how your business operates.
Chart of Accounts Numbering
Most accounting software includes a standard chart of accounts with a predefined numbering system. These account numbers help organise the accounts into categories, making it easier to record transactions and produce financial reports. Although the numbering varies between software providers, the basic structure is very similar.
Bank and cash accounts are often handled slightly differently. Instead of creating them directly in the chart of accounts, they’re usually added through the banking section of the software. Once connected, your bank transactions are imported automatically, making bank reconciliation much quicker and reducing the need for manual data entry.
The following examples show how different accounting software numbers its chart of accounts.
Xero Sample Chart of Accounts – taken from the demo
| Description | Number |
|---|---|
| Bank | 090 – 199 |
| Revenue Accounts | 200 – 299 |
| Direct Costs | 300 – 399 |
| Overheads | 400 – 499 |
| Current Assets | 600 – 699 |
| Fixed Assets | 700 – 799 |
| Current Liability Account | 800 – 949 |
| Equity | 950 – 999 |
QuickBooks CoA
| Description | Number |
|---|---|
| Assets | 10000 – 19999 |
| Liabilities | 20000 – 29999 |
| Equity | 30000 – 39999 |
| Income | 40000 – 49999 |
| Cost of Goods Sold | 50000 – 59999 |
| Expenses | 60000 – 69999 |
| Other Income | 70000 – 79999 |
| Other Expenses | 80000 – 89999 |
As you can see from the two accounting numbering examples, the systems are different. Xero uses smaller numbers than QuickBooks. Sage UK uses a different numbering system starting from 0010 and ending at 9999. Don’t worry about the system you use, as you will soon get used to the account codes and where to add them.
All accounting packages use an accounting chart of accounts. Bookkeeping software is more flexible and often saves businesses time on the accounts.

Chart of Accounts Example
Our sample chart of accounts uses the numbering system from Xero. It is a simple set that will show how they are formatted. It is split between bank, income, direct costs, expenses, assets, liabilities and equity.

Download the above list in PDF format.


The Financial Statements
The chart of accounts determines where each transaction appears in your financial reports. Using the correct accounts helps produce an accurate Balance Sheet and Profit and Loss Account, making it easier to understand how your business is performing. To understand how the chart of accounts fits into the accounting process, read our accounting basics guide.
Here, we will look at the two main reports, the balance sheet and the profit and loss report.
The Balance Sheet Accounts

The balance sheet accounts give a snapshot of the business on any given date. It consists of the following accounts. It is used to see the financial health of the company.
Asset Accounts
Assets are what the business owns and include the following:
Fixed Assets – Physical items such as computers, machinery, furniture, fixtures, and fittings.
Intangible Assets – You can’t see these assets; examples are goodwill, trademarks and patents.
Current Assets – Assets a business can quickly convert to cash, including cash, bank balances, and accounts receivable.
Liability Accounts
Liabilities are amounts the business owes to other businesses or individuals. They are split into two:
Current liabilities are short-term debts the business owes, including accounts payable, short-term obligations, and accruals.
Long-term liabilities are debts with maturities of more than 1 year, including mortgages and long-term loans.
Equity Accounts
Equity accounts show the ownership of the business; the accounts might include owners’ and shareholders’ equity, as well as retained earnings.
The Income Statement Accounts
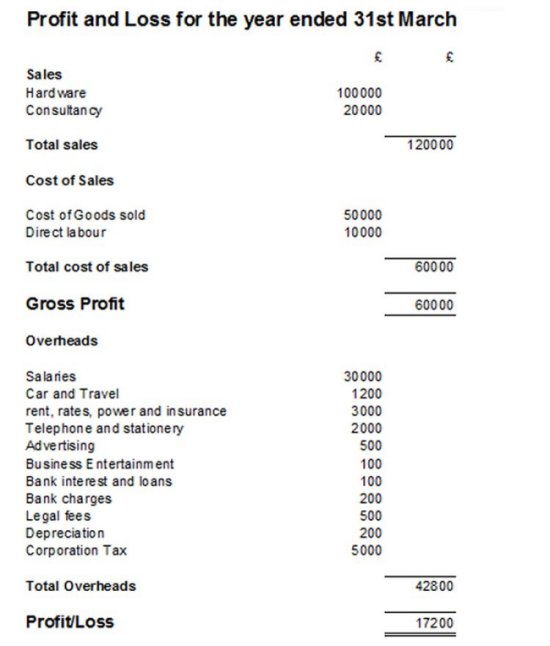
The Profit and Loss Account shows your income and expenses over a set period and whether the business has made a profit or loss. The chart of accounts determines where each type of income and expense appears in the report.
Income Statement Accounts – These are the income accounts for the business. The size and type of sales will determine the account codes you may need. A few examples include product sales, consultancy, parts, support, and interest received.
Cost of Sales – These are the costs that relate directly to the income accounts and might include wages, parts and packaging.
Expense Accounts – These are the main expenses of a business and include general office expenses, utilities, wages, travel and insurance.
Trial Balance
A report that bookkeepers and accountants use is a trial balance. The trial balance lists all the accounts and the debits and credits related to them.
The trial balance helps show all the accounts on a single report and is used mainly at the financial year-end.
Non-Profit Chart of Accounts
When setting up a non-profit, you will need to check whether you have any specific restrictions on funds.
For example, a donation may be restricted to specific expenses. Suppose there are restrictions; set up nominal codes to track the balance for that fund. Another way to track restricted funds is to use classes or departments in certain cloud accounting packages.
Most small non-profit organisations can work with a simple set of CoA.
Adding Nominal Codes
When you need to add new nominal codes to your CoA, it is worth checking whether a code already in use is suitable for the purpose. If not, choose the best code number and complete the details. To check what information is needed, look at previous code details, which should help.
If you need to edit a nominal code, check to see if the transaction has already been posted and if it will cause any problems with the previous transactions. In most cases, it is better to set up a new code.
Chart of Accounts UK
The UK operates similarly to other countries in many respects; however, one notable distinction lies in the VAT (Value Added Tax) rates. You can enter the VAT rates when setting up nominal codes for financial transactions in the UK. The standard VAT rate is 20%.
Chart of Accounts FAQ
Chart of Accounts Summary
In this article, we have looked at the chart of accounts and how it works to produce financial reports, including the balance sheet and the profit and loss statement. There are five main categories of accounts: assets, liabilities, equity, income, and expenses. Each category represents a different aspect of a company’s financial transactions.
Related Pages
To learn more about bookkeeping and financial statements, read our guides to General Ledger, Trial Balance, Balance Sheet, Profit and Loss Account and Double Entry Bookkeeping.
Last updated: July 2026
